Showing posts with label Agile. Show all posts

Monday, 30 November 2015

Do we need to deploy clean up work if there is no additional functionality? i.e no (perceived) business benifit.

Background

We recently did some work to a number of services where all we were doing was removing some old functionality that is no longer used (obsolete code). Removing messages, handlers, classes, tests. I like deleting code, it makes things simpler, less logic to break, less places for bugs to hide. Once we finished, we wanted to get all of this released to prod ASAP. We tested all of the areas affected in a large system level test in the preprod environment, all of the services (and others that had not changed) working together.

But we had push back. 

Push back

The question was: Why do you need to release this clean-up in advance of any further work?
By doing so you are making this an active rather than passive deployment with associated extra risk and double the cost.
If you are removing unused code you can just deploy with the next addition/change to code because by testing that you are implicitly testing that absence of code. Even if the new code isn’t affected, then our deployment checklists cover that situation too – we have already double checked this removal/clean-up of code won’t have an impact on production

Rebuttal

I broke this down into a number of sections. A number of questions that I thought were being asked in the statement.

Question: Why do many releases instead of one, isn’t that more risky?
This is a question from the old skool of thought, releases are big bad things we need to do as few as possible.
Answer: I would say many small releases are inherently less risky.
If (very unlikely but) if something goes wrong it will be less clear what caused the issue. Was it new functionality, or the clean-up work that is the culprit?
If we release now, we know what to monitor over the coming days, and have to monitor less
If we don’t deploy all 8 things, someone else will (at some point and in some cases many months in the future). This poor soul will need to decide if the changes we did need testing, what the consequences of the changes are, and worry about if there are other dependent services to deploy.
Each service is push button, so deploy time is small.
Rollback is not hard if we need it with no business consequences at the moment. In future if we release with other functionality and the changes we have made break something we need to rollback new functionality too.

Question: If we are removing code why the need to release anything? There is no new functionality to release.
I guess this is a question about business value, no new business value no need to release.
Answer: That is true, its mostly removing old code and cleaning up. But its just as critical, almost more so to get this out in a small release sooner, as we may (again unlikely but possible, we are human) have removed something we should not have.

Question: Won't it be more to test doing it twice?
This assumes that we manually test everything on every release. where actually we only test what has changed manually in conjunction with automated testing for the rest.
Answer: We have already done good full end to end testing last week of the 8 things affected. If we wait until next week or the week after we will have to do the tests again as the versions of things to be released will all be different by then, so will need to test the 8 deployable things again full stack = extra 1 day

Other reasons for deployment.
The changes, what we did and why we did it, are still fresh in our minds. The longer we leave it the less sure we are that we will be doing the right things.
Its not critical, but I'd prefer not to do a partial deployment (service-X is going to get released soon) I'd like the rest of the clean-up to be deployed too.
Ideally prod and preprod are as same as possible (for environmental consistency and testing reasons). Any differences between the test system of preprod and prod invalidates other testing efforts. Because in prod services will be integrating with a different version of other services than that are in preprod making like-for-like testing impossible.

Conclusion

I maintain there is business benefit in doing the deployment now, and deploying all 8 services at that. To be fair businesses, managers, stakeholders, even developers (especially senior ones) have all seen their fair share of long deployments, failure and difficult rollbacks. Leading, ultimately to a fear of deployment. So it's natural to want to avoid the perceived risks. But perversely by restricting the number of deployments you are actually increasing the likelihood of future fail.
A core philosophy of the devops culture is to release early and often (continuous delivery). By doing the things you find painful more often you master them and make them trivial, there by improving your mean time to recovery.

The business benefit is ultimately one of developer productivity, testability and system up-time

Wednesday, 15 October 2014

Blue green web deployment with powershell and IIS

I wanted to follow up my earlier post (about our current CD process) with a more technically focussed one, one that can describe the nuts and bolts of the actual BlueGreenDeployment.

Technology 

Powershell, powershell and powershell, oh and windows, IIS and Go (build server)

Process

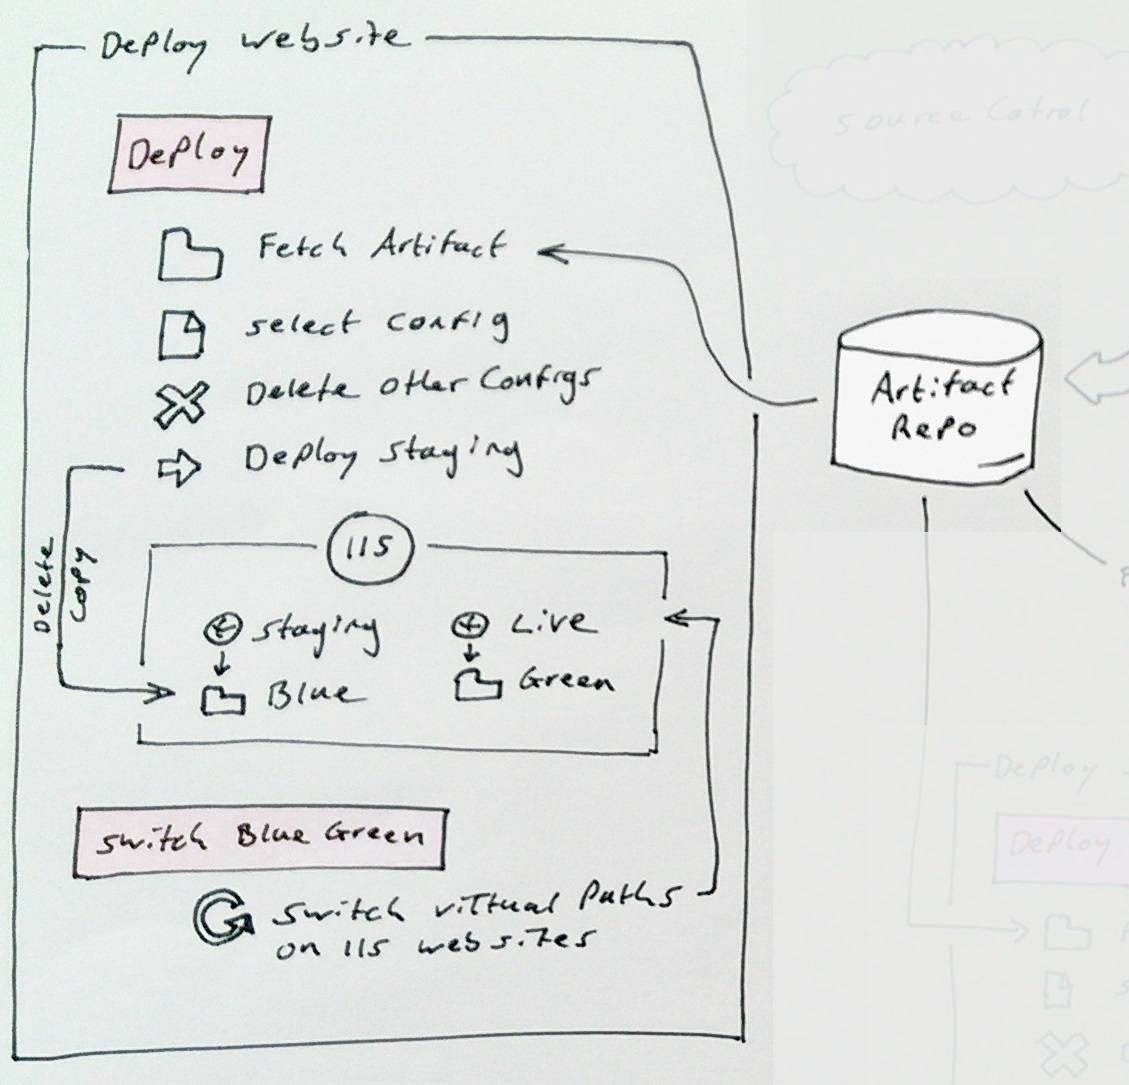
As I described in my earlier post the blue green web deploy consists of these steps:


1. Deploy
1.1 Fetch artifact
1.2 Select the config for this deployment
1.3 Delete the other configs
1.4 Deploy to staging (delete then copy)
1.5 Backup live

2. Switch blue green
2.2 Point live to new code
2.3 Point staging to old code

Blue Green Deployment

Before diving in to the details I should firstly convey what blue green deployments are, and what they are not.
There are a few different ways to implement blue green deployments but they all have the same goals:
1. Allow testing on live without actually being live.
2. Enable deployments to have the smallest possible impact on the live service as possible.
3. Give you an easy roll-back path.

This can be accomplished in many ways. Techniques include DNS switching, directory moving, or virtual path redirecting. 
We have chosen to do IIS physical path redirecting. This allows us to do the same technique on all our environments from test to live, same scripts, same code, and doesn't cost as much as requiring multiple servers which DNS switching would require.

Commands used for this demo are

PS> .\Create-Websites.ps1 -topLevelDomain co.uk
PS> Deploy-Staging -source c:\tmp -websiteName foobarapi -domainName foobar.co.uk
PS> Backup-Live -WebsiteName foobarapi -DomainName foobar.co.uk
PS> Switch-BlueGreen -WebsiteName foobarapi -DomainName foobar.co.uk

The code I'm going to talk through is all located here: https://github.com/DamianStanger/Powershell

Conventions used:

All websites are named name.domain and name-staging.domain
All backing folders are in c:\virtual and are named name.domain.green and name.domain.blue
You don't know if blue or green is currently serving live traffic.
Backups are taken to c:\virtual-backups\name.domain
Log files always live in c:\logs\name.domain
There is always a version.txt and bluegreen.txt in the root of every website/api

In this example I'm using name=foobarapi and domain=foobar.co.uk

The technical detail

This is the meaty stuff, it consists mainly of powershell, and should work no matter what CI software you are using. I can heartily recommend Go by Thoughtworks. It has a built in artifact repository and brilliant dependency tracking through its value stream map functionality.

Setup IIS and backing folders

To test my deployment scripts you will firstly need to set up the dummy/test folders and IIS websites. For this you can use this script: Create-Websites.ps1. I'm not going to go into detail of the script as its not the focus of this post but it creates your app pool and website.

The code is exercised with the following:
setupWebsite "foobarui" "foobarui-test" $true "green"
applyCert("*.foobar.*") <<optional if you want the sites to have an ssl cert applying>>

This will create 2 websites on IIS pointing to the green and blue folders as per the conventions outlined further above. Finally apply an SSL certification using powershell, this command will apply the SSL cert to all the websites in this instance of IIS.
To remove the created items from IIS issue commands similar to this:
PS> dir IIS:\AppPools | where-object{$_.Name -like "*.foobar.co*"} | Remove-Item
PS> dir IIS:\Sites | where-object{$_.Name -like "*.foobar.co*"} | remove-item
PS> dir IIS:\SslBindings | remove-item

Once you have the websites correctly set up you can then utilise the deploy blue green scripts :-)

Deployment

The Blue Green deployment module is located here: BlueGreenDeployment.psm1 and will need importing into your powershell session with the following command:
PS> Import-module BlueGreenDeployment.psm1
Once you have the module imported you can issue the following commands:
PS> Deploy-Staging -source c:\tmp -websiteName foobarapi -domainName foobar.co.uk
PS> Backup-Live -WebsiteName foobarapi -DomainName foobar.co.uk
PS> Switch-BlueGreen -WebsiteName foobarapi -DomainName foobar.co.uk

Lets dig into these one by one.

1. Deploy-Staging
This is quite straight forward. Find the folder that is currently serving staging and copy the new version there. The interesting bit of code is the method of determining which folder to replace with the new version. IsLiveOnBlue and GetPhysicalPath work together to determine the folder in use on staging. Notice the retries inside GetPhysicalPath I found that sometimes IIS just doesn't want to play, but if you ask it a second time it will?? Don't ask..
The code that actually determines the physical path is:
$website = "IIS:\Sites\$WebsiteName.$domainName"
...
$websiteProperties = Get-ItemProperty $website
$physicalPath = $websiteProperties.PhysicalPath

The rest of the powershell is relatively straight forward

2. Backup-Live
Backing up live is again pretty standard powershell. Again determine the folder that is serving live then do a copy. Done.

3. Switch-BlueGreen
Performing the switch is actually really easy when it comes to it. Firstly determine which folder (blue or green) is serving live (same code as the deploy step) and then switch it with the staging website.
Set-ItemProperty $liveSite -Name physicalPath -Value $greenWebsitePath -ErrorAction Stop
The only added complication is the rewriting of the log file location in the web.config. Log4net only really works well if one process (web site) uses one log file. Again you can look this up yourselves as this is an aside to the main purpose of this post.

Conclusion

The interwebs in general are full of articles/opinions/tales of how bad windows is to automate, it actually winds me up. Maybe it used to be true but I've been finding that with powershell and Go I've been able to automate anything I need. It's so powerful. Don't let the microsoft haters stop you from doing what needs to be done.

The blue green deployment technique outlined here is working really well for us at the moment and has helped us to take our projects live sooner/quicker and with more confidence.

Automation for the win.

Sunday, 12 October 2014

Adventures in continuous delivery, our build/deployment pipeline

Overview

We have been undergoing a bit of a dev-ops revolution at work. We have been on a mission to automate everything, well as much is as possible. Exciting times but we are still only just setting out on this adventure, I wanted to document where we are currently at.

First a brief overview of what we have. We have many many small windows services, websites and apis each belonging to a service and performing a specific role. I must quickly add we are a microsoft shop. More and more are our services moving towards a proper service orientated architecture. I hesitate to use the term micro services as it's so hard to pin a definition on the term but let's just say they are quite small, focused on a single responsibility.

We have 5 or 6 SPA apps mainly written with durandal and angular. 7 or 8 different APIs serving data to these apps and to external parties. 10 to 15 windows services which mostly publish and subscribe to N service bus queues.

We currently have 8 environments that we need to deploy to (going to be difficult to do this by hand, me thinks) including CI, QA*, Test*, Pre-prod* and live* (* the last 4 are doubled as we deploy into 2 different regions which both operate slightly differently and have different config and testing). This list is growing with every month that passes. We really really needed some automation, when it was just 3 environments in the UK region we just about got by with manual deployments.

I'm going to outline how the build pipeline integrates with the deployment pipelines and the steps that we take in each stage. But I'm not really going to concentrate on the actual technical details, this is more of a process document. 

1.0 The build pipeline

We operate on a trunk based development model (most of the time) and every time you check in we run a build that will produce a build artifact, push that in to an artifact repository and then run unit and integration tests on the artifact. 

Fig 1. The build pipeline

Build

1. Run a transform on the assembly info so that the resultant dll has build information inside the details. This aids us determine what version of a service is running on any environment, just look at the dlls properties.
2. Create a version.txt file that lives in the root of the service. This is easily looked at on an API or website as well as in the folder containing a service.
3. We check in all the versions of the config files for all the environments that we will be deploying to and use a transform to replace the specific parts of a common config file with environment specific details (e.g connection strings). Every environment's config is now part of the built artifact.
4. Build the solution, usually with msbuild, or for the SPA apps, gulp
5. If all this is successful upload the built artifact to the artifact repo (the go server)

Test

6. Fetch the built artifact
7. Run unit tests
8. Run integration tests

The test stage is separate so that we can run tests on a different machine if necessary. It also allows us to parallelise the tests running them on many machines at once if required.

Not shown on this diagram are the acceptance tests, these are run in another pipeline. Firstly we need to do a web deploy (as below) then setup some data in different databases and finally run the tests.

2.0 The web deploy pipeline

So far so good, everything is automated on the success of the previous stage. We then have the deployment pipelines of which only the one to CI is fully automated so that acceptance tests can be run on the fully deployed code. All the other environments are push button deploys using Go.
The deployment of all our websites/APIs/SPAs are very similar to each other and the same across all the environments so we have confidence that it will work when finally run against live.

Fig 2. The web deploy pipeline

Deploy

1. Fetch the build artifact
2. Select the desired config for this environment and discard the rest so there is no confusion later
3. Deploy to staging (I've written a separate article on this detailing how it works with IIS powershell and windows)
a. Delete the contents of the staging websites physical path
b. Copy the new code and config into the staging path

Switch blue green

We are using the BueGreenDeployment model for our deployments. Basically you deploy to a staging environment then when you are happy with any manual testing you switch it over to live with the use of powershell to switch the physical folders in IIS of staging and live. This gives a quick and easy rollback (just switch again) and minimises any down time for the website in question.

3.0 The service deployment pipeline

Much the same as the deployment of websites except for the fact the there is no blue green. The Services mainly read from queues and so this makes it difficult to run a staging version at the same time as a live version (not impossible but a bit advanced for us at the moment)

Fig 3. The service deploy pipeline

Deploy

The install step again utilises powershell heavily, firstly to stop the services, then back things up and deploy the new code before starting the service up again.

There is no blue green style of rollback here as there are complications to doing this with windows services and with reading off the production queues. There is probably room for improvement here but we should be confident that things work by the time we deploy live as we have proved it out in 2 or 3 environments before live.

Summary

I'm really impressed with Go as our CI/CD platform it gives some great tooling around the value stream map, promotion of builds to the other environments, pipeline templates and flexibility. We haven't just arrived at this setup of course, its been an evolution which we are still undergoing. But we are in a great position moving forward as we need to stand up more and more environments both on prem and in the cloud.

Fig 4. The whole deployment pipeline

Room for improvement

There is plenty of room for improvement in all of this though

* Config checked into source control and built into the artifact
Checking the config into the code base is great for our current team, we all know where the config is, its easy to change or add new things to it. But for a larger team or where we didn't want the entire team to know secret connection string to live DBs it wouldn't work. Thank goodness we don't have any paranoid DBAs here. Also there is a problem if we want to tweak some config in an environment. we need to produce an entire new build artifact from source code, which might now have other changes in it that we don't want to go live. We can handle this using feature toggles and a branch by abstraction mode of working but it requires good discipline which we as a team are only just getting our heads around. Basically if the code is always in a releasable state this is not an issue.

* Staging and live both have the same config
When you do blue green deployments as we are doing, both staging and live always point to the live resources and databases, so it's hard to test that the new UI in staging works with the new API, also in staging as both the staging and current live UI will be pointing to the live API. Likewise the live and staging API will both be pointing to the live DB or other resources. Blue green deployments are not designed for integration testing like this, that's what the lower environments are for.
On a very similar vein, logging will go to the same log files which can be a problem if your logging framework takes out locks on files, we use log4net a lot which does. There are options to work in a lock when required mode with log4net but it can really hit performance. We have solved this by rewriting the path to the log file on blue green switch.

* No blue green style deployments of windows services
The lack of blue green deployment of services means that we have a longer period of disruption when deploying and a slower rollback strategy. Added to this you can't test the service on the production server before you actually put it live. There are options here but it gets quite complicated to do, and by the time the service is going live you should have finished all your testing by now.

* Database upgrades are not part of deployment
At the time of writing we are still doing database deployments by hand, this is slowly changing and some of our DBs do now have automated deployments, mainly using the redgate SQL tool set, but we are still getting better at this. It's my hope that we will get to the fully automated deployments of data schemas at some point, but we are still concentrating on the deployment of the code base

* Snowflake servers
All our servers both on prem and in the cloud are built, installed and configured manually. I've started to use chocolaty and powershell to automate what I can around set-up and configuration, but the fact still remains that its a manual process to get a new server up and running. The consequence of this is that each server has small differences to other servers that "should" be the same. This means that we could introduce bugs in different environments due to accidental differences in the server itself.

* Ability to spin up environments set up as needed for further growth 
Related to the above point, as a way to move away from the problem of snowflake servers we need to look at technologies like puppet, chef, Desired state configuration etc. If we had this automation we could spin up test servers, deploy to other regions/markets, or scale up the architecture by creating more machines. 

Relevant Technology Stack (for this article)

• Windows
• Powershell
• IIS
• SVN and Git
• Msbuild and gulp

Next >>

Ive written a follow up article to this which details the nuts and bolts of the blue green deployment techniques we are currently using. blue-green-web-deployment-with-IIS-and-powershell.
The code for which can be found on my git hub here: https://github.com/DamianStanger/Powershell/

Friday, 20 June 2014

Story points vs numbers of stories. What's the best way to predict your project completion date? Or are estimates worth it?

Do story points actually help in estimation and the prediction of project milestones and end dates? Given the inherent inaccuracy of points can we save time by skipping the estimation process?
We estimate our stories in story points (2, 4 or 8 points representing small medium or large). We try and do this when the stories get added to the back log so that we can better plan the upcoming work.

But personally I don't really think the effort required to estimate the stories is worth it, maybe we should plan just with the numbers of stories instead?

Id like to highlight my thoughts with actual data rather than hearsay and conjecture. Opinion pieces are all very well but sometimes you just need to 'show me the data'.

Comparison of the two different metrics

We have been going with our current project for 16 iterations/weeks now, we had one major release at iteration 6 and we are now approaching the next major release for this project. I wanted to take this opportunity to reflect on the no-estimates debate, is there any point in estimates, I will let the numbers do the speaking for me.

Here is our velocity first in terms of story points then in terms of stories completed:


Velocity in story points


Velocity in numbers of stories

The following 2 graphs tracking the amount of work done vs remaining. The first is an agile burn up chart, the second a lean cumulative flow chart


Burn up (story points)


Cumulative flow (numbers of stories)

And here are the statistics around the numbers of stories that we have:
13 stories/spikes with no points. 39 with 2 points. 29 with 4 points. 5 with 8 points

Conclusions

Apart from the fact that there has been a lot of scope creep and our velocity has fluctuated wildly, what do the graphs tell us?

Well at the beginning of the project, like almost every project I've ever worked on we thought we had most (but not all) of the requirements captured, and like most of the projects I've ever worked on we were wrong, very wrong. The scope doubled from 120 points (40 stories) to 240 points (80 stories) from the start of the second phase up to now. So using points or numbers of stories gave a very misleading picture of the scope and hence estimated completion date, No difference in metrics here then.

Our velocity trend is either 15 points or 6 stories, whichever measurement of velocity you use the estimated end date (as of this writing) is the 20th July. Both the burn up and the cumulative flow diagrams show how scope has been added with each iteration as we discover new requirements. As with everything we do we have to ask is that thing that we do adding value?

So I think we could ditch estimates. But this is the thing, we MUST sill analyse stories properly, must break them down into small independent stories (always remember to INVEST in your stories). And we as a team must still discuss the stories before we pick them up to work on.

Appendix

You might ask what happened in early may when the graphs flat line (iteration 20)? Well half the team was needed for an urgent fix/deploy to another system at the same time as holidays from 2 other team members, then we had to ramp up the team again (with different team members).
And why the fluctuations in velocity? well the team changed quite regularly, the time when we were the most productive was (unsurprisingly) the time when the team was the most stable and we weren't getting distracted with other projects and maintenance work.

All graphs are produced curtsey of the Mingle agile project management software from ThoughtWorks, its a great tool for managing your agile projects. We moved from Trello to Mingle around about the new year but that is a different story for a different blog post.

Indecently I'm not even going to mention burn down charts, I've long since abandoned them, they are so limited for trying to visualise the actual picture of what is going on in a given release. If you want to see a good explanation of burn ups vs burn downs just Google it, or look at this example here: http://brodzinski.com/2012/10/burn-up-better-burn-down.html
I realise not everyone sees it my way, and I guess if you have stable/full requirements and want to track work in detail in a given iteration then burn down might work for you but in our experiences it just causes confusion to management and stakeholders. They may end up asking the question 'why is your burn down going up?' or 'why is it flat?'. They don't know if you did nothing or were adding features at the same rate as knocking them off.
Ok, ok, sorry I did mention burn down charts, sorry....

Monday, 24 March 2014

Visualising the Thoughtworks Go pipline using Cradiator, a build information radiator/monitor


You know the old adage, 'out of sight, out of mind'? Like it or not, sometimes the state of the build on CI is forgotten about, and if you can't see the current state without going looking for it, it can stay red for a few days before it's noticed by someone.

I've always been a big fan of information radiators, build monitors, graphs and stats that are in peoples faces, and I just wanted to share our current solution to the whole 'who cares if the CI server is not Green' problem.

We use Go (the CI server from Thoughtworks) for our build and deployment pipeline, which is great. Although it doesn't ship with a build monitor that can be installed on a machine to show the state of the build, Thoughtworks do expose an API that allows you to build your own, for example on http://Server:Port/go/cctray.xml

We found an old-ish project called Cradiator that works with cruse control (remember that old build server? it turns out that Go has the same API, all be it on a slightly different URL). The problem was that we have secured our instance of Go so that you need to be logged in to access it. This caused problems with Cradiator and so we forked it and added the ability to set your own credentials in the config. The fork can be found here.

Below are a couple of screen shots showing the Go build server and also the corresponding Cradiator screen.
Our Go pipeline for this small part of the overall system

The Cradiator build monitor screen

As you can see every stage within a Go pipeline has a corresponding line in Cradiator. To achieve this, we use the following filter in the Cradiator config file: project-regex="^.*::.*::.*"

There is a robotic voice that announces who broke what, with some good catastrophic sound effects to accompany it. It's doing a great job of focusing people on fixing things if/when they go red.

Ever since we have started using this, the average time of a red build to a check in fixing it is less than an hour. Visibility for the win.

References:

https://github.com/DamianStanger/Cradiator

Thursday, 20 October 2011

Kanban inspired card wall. Our example

Overview
Some call them 'card walls', some 'story walls', others just 'the wall'. There are many names given to the wall but its purpose is the same, to convey project information to the team and other interested parties / stakeholders. I work on a software development team but Kanban boards can be applied to any process, from manufacturing to household to-do lists. Honestly the uses are as wide ranging as your imagination. But this article concentrates on software development.

Some teams practice 'scrum' and put tasks on the wall, some XP and run on weekly/2 weekly/4 weekly iterations, but we are running in a kanban mode at the moment, applying Work In Progress (WIP) limits as best we can.

I've worked on many different teams, with many different types of wall/board, from scrum to xp, from big walls to tiny boards. I think the Kanban inspired wall we are currently running with is the best I've have the good fortune to use. So I thought I'd share - I'll try to run you through it as best as I can.

The wall
We are fortunate enough to have a very big space for our card wall (3-4 metres wide). I have been on teams that have had to manage with a small white board. Having said that, we have still filled every available space, and it would be nice if we had even more.

The size allows us to show lots of project relevant information and also include plenty of room for up stream activities like information architecture (IA), user experience (UX) and analysis. So we have lots of visibility as to the state of all aspects of the project.

The Columns
The columns are detailed below in their own sections, but to summarise they are:
  • Design
    • In visual design
    • In customer testing
    • In front end dev
  • Analysis
    • In analysis
    • Selected for dev
  • Development
    • In dev
    • Dev complete
  • QA
    • In QA
    • QA complete
  • Done
  • Technical tasks
  • Risks
The WIP Limits
Work In Progress limits help us to focus on the tasks currently in play. Too many tasks on the board at any one time can mean the team is spread too thinly. Traffic jams can occur and important bug fixes won't get through quickly.

Example without WIP limits:
Two big stories have just been finished and so QA now gets to work on them, whilst the developers start on new stories. At this point all four dev pairs are busy, as are the two QAs. A day later the testing is still not complete and another pair finishes their story, this story gets queued up in waiting for QA. If there were no WIP limits the pair would start a new story and get on with that work. But what happens if there is then a bug in one of the stories, a big bug? Who should pick it up? A dev pair need to stop what they are doing mid flow, shelve all their current checked out work, context switch to the bug, investigate and fix it. I guess you know where this is going, with effectively three stories in QA and four stories in dev everyone is going to be flip-flopping between stories and bug fixes. Context switching costs time and the whole process reduces our ability to respond to change. The main consequence being that throughput and velocity suffer, not to mention the headaches of leaving half finished code laying about whilst you fix something else.

By limiting the number of stories in each column this does not happen (well, much much less so). Developers are always available for fixes and everyone experiences less context switching and more uninterrupted flow.

The Story Cards
We have four different coloured cards on the wall: yellow, blue, white and pink. The different colours mean different things depending on where they are on the wall, but its quite straight forward.
  • Yellow: Design tasks, our UX guys work on the yellow cards in the first 3 columns, either working on the IA, wire frames, or styling of up coming stories.
  • Yellow: Development tasks, tech tasks and tech debt. All things that are not stories but need playing, e.g.: Set up performance test environment, or refactor X to remove duplication, or even spike out Y to prove integration points.
  • Blue: Features under analysis. These cards only appear in the analysis and done columns and represent whole features, big things. I think there are around 15 in release one.
  • Pink: Bugs, simples [sic].
  • White: Most of the cards flowing across the wall are white. These denote stories that require dev effort. We try to ensure that all the white cards can be finished in 1-4 days

White Story Card
  • Story number for reference in Mingle or TFS.
  • Story title, brief, must fit on one card in thick writing.
  • Days in play (the dots get added every morning before our daily stand up meeting) This allows us to see how long cards take to flow through the wall.
  • Story point estimate (size/complexity)
  • Relevant notes can be captured on the reverse if needed.

Yellow Tech Card
  • Usually these do not have reference numbers.
  • Usually no estimate either.
  • Just a brief description of the work required.
  • Again relevant notes can be captured on the reverse if needed.

Flow across the wall
Features start their life in the 'In analysis' column. All the features that are designated for release 1 are in this column in priority order. Whilst the BAs are working on splitting stories out, the UX and IA guys are also looking into how best to fulfil the users requirements from a design perspective, and they put their own cards up on the left of the board.
Once a story is ready to be developed, a white card is placed in the 'Selected for dev' column and waits here until a dev pair is ready to pick them up. At which point they are moved in to 'In dev' until the pair has showcased the story to the QA and BA's satisfaction at which point it moves into dev complete (awaiting QA).
The QAs pick up cards and work on them in the 'In QA' column. Cards NEVER move backwards, if there are bugs to fix a dev pair will move to fix it in the QA column, whatever they were doing will remain in the 'In dev' column. Once the QA is happy with the card it will move into 'QA complete' where the BAs now showcase the story to the product owner before moving it to 'Done'.

The Columns In Detail
Design
Walls I've often worked with in the past have not had a design area on them. This project has a heavy design and UX aspect and so it was important to have this area on the wall so we can all see what features are at which point in the process.
The columns we have here are: 'In visual design' for development of the wireframes and IA; 'In customer testing'; and 'In front end dev' for development of the UX including styling and image creating.

Analysis (WIP 6)

The Analysis columns consist of 'In analysis' which list all the features of the current release (release one is about nine months) we keep stickies on the features (blue cards) to show how complete features are. The 'Selected for dev' column is used for the next stories to be picked up by the dev team (white cards), these stories should have been through the analysis process and be ready for devs to pick up, this column also serves as a heads up for the QAs so they can start getting ready for stories, working out acceptance criteria and so forth with the BAs and devs.

Dev (WIP 4)

We currently have four dev pairs and so have set our WIP limit to four for the combination of the two dev columns. At the beginning of the project we set the WIP limit to three as we always had a pair on tech tasks, environment set up and the like, but now we are moving into the second half of the first release most of that type of task has been finished. If there are four white cards in the two dev columns the next pair to finish should help out with the testing effort or work on some tech tasks. This helps keep the actual work in progress on the board to a manageable amount.

QA (WIP 2)


The 'In QA' column has a WIP limit of two as we have two testers. If a story gets blocked due to a bug then devs need to come and help clear the blockage. The card can NEVER move back into dev and the QA can't pick up a new card from dev complete until the issues are resolved. This focuses attention and ensures that stories progress along the wall in a timly manner, always the empasis on getting completed work 'done done' so that we can claim the points, and move on.

Done (Done Done)

This column contains all the stories finished this week. Done Done. These stories are ready to be showcased to the product owner and will be demoed to the entire client user team (all stakeholders) on the Friday of each week. Every Monday all the cards are removed from this column so we can see what has been finished this week and so that the product owner and other stackholders can see the progress since last Friday's showcase.

Metrics


This area contains all the different metrics, the different graphs and guides.
  • Cumulative Flow
  • Weekly Velocity 
  • Points Burn Up
  • Risk Count
  • Story points Guide
  • Done Done Guide

Risks/Issues/Tech Tasks/Tech Debt Wall
There are four columns to this section of the wall. The left most three are for 'tech debt', and tech tasks. The right most is for capturing risks and making them more visible.

Column 1 (Things we must do to make the project successful).
Things like integrate with the corporate authentication system, spike asset management or setup performance testing environment.

Column 2 (Things that would enable us to deliver faster)
Includes things like refactor acceptance tests to reduce build time, and optimise windows configuration on all dev machines.

Column 3 (Things that are not essential to the success of the project but will give us a better solution)
Mainly includes lists of refactorings and areas we want to achieve better test coverage.

Column 4 (Risk wall)
Any risk to the project, from integration points, new technology, people, to computers and hardware. Listed in highest risk at the top. The arrow represents whether the risk is increasing or decreasing as time passes.

Summary
So that is our wall. It saves us time, keeps us focussed on what's important, and neatly tracks our progress.

How does your team work? I would be interested to know what other types of walls are out there. I've seen a few in my time but there is always another way of doing it - what does your wall do for you?


Glossary 
BA - Business Analyst
IA - Information Architecture
Kanban - http://en.wikipedia.org/wiki/Kanban
Mingle - http://www.thoughtworks-studios.com/mingle-agile-project-management
QA - Quality Analyst
Scrum - http://en.wikipedia.org/wiki/Scrum_(development)
Tech Debt - http://martinfowler.com/bliki/TechnicalDebt.html
TFS - Team Foundation Server
UX - User eXperiance
WIP - Work In Progress
XP - eXtreme Programming - http://en.wikipedia.org/wiki/Extreme_Programming

Wednesday, 31 August 2011

How much does your slow machine cost your company?


The problem

I'm currently working at your standard large company. The computers are managed centrally and are replaced every 3 or 4 years or so. The machine I'm working on is a Dell running Windows 7 32bit with 3.21 GB of ram, an Intel core 2 duo CPU at 3GHz and on-board graphics running 2 monitors. Not a terrible machine you may say, but far far from good enough as a developer machine.

We are developing an MVC 3 enterprise web app running on SQL Server 2008, LINQ to SQL, VS2010, Resharper 6, TFS integration. Javascript tests, unit tests, integration tests, feature tests and acceptance tests make up a sizeable testing suite. As you can imagine, this set-up can put quite a load on the machines especially as our app has been growing fast. Our team's velocity is still good, so the code base is growing quickly.

We are finding that the machines hang periodically. All the dev machines are quite slow and all exactly the same spec but for some reason, a few are terribly slow, and we avoid pairing on those machines. Then there's the 30-60 second waits for visual studio builds, the 5 minutes for the check-in builds, the time to compile and run tests as you are doing TDD, the time our tests run for, the 10 seconds+ for visual studio and resharper to refactor things, find things. It all adds up, but how much does it cost? Not only does it cost in terms of wasted time but also in context switching. For example, you're doing TDD, you write a test, do some coding and hit run test but have to wait 30 seconds+ for it to run. This takes long enough to break your flow, you have a quick think about something else and then you realise the test has run and you need to switch you attention back. You might have a quick chat about something else with your pair.

We know it's hurting our velocity but without numbers it's difficult to convince management of the true costs.

So what did we do?

We took a stop watch, kept it with us all day and recorded all the time that where we were waiting for the computer to do something - from opening apps, running builds and tests, searches and refactorings in visual studio - any time at all where the developer had to wait for the machine to work, be it 5 seconds or 5 minutes the stop watch was running. It took quite a lot of discipline. The results were startling.

Results

I did this for a week, every day, and so did a colleague. Our results were very similar in that on average we were sitting unproductive for a collective time of 30 to 60 minutes a day with a couple of days at 15 minutes (mainly due to days with meetings) and a couple of days at a whopping 75 minutes (these were days when perversely we were going quite quick and getting things done, but running builds/tests/check-ins all day takes time).

So lets say 40 minutes wasted per pair per day. That sounds like a lot, but it's how long the stopwatch said. You try it for a day. What are your numbers?

The machine

We are running Windows 7 on a machine that originally was running server 2003, so the requirements on the machine are different. We have turned off all the Aero UI elements from the machines (we have on board graphics). We've turned off the virus checking (controversially, as this is a corporate environment), and followed numerous tutorials on the internet about improving the speed of windows, but all to no avail.

If we had a faster, better, newer machine, then how much would we gain? Well that's subjective, but for arguments sake, say we had a great machine and could cut all the waiting/processing time in half  (*1)

The Costs

What is the cost to the business of one dev per day? It depends on your company, your devs, their seniority, your support staff, building costs, electricity etc. There are many factors, but let's say £200 (this is a conservative estimate *2)

Our team consists of 10 devs, 3 UI/UX/designers, 2 QAs/testers, 2 BAs (analysts), 1 PM (manager) = 18 people. If we assume they each cost a nominal £200 per day, that is £3600 a day for the team as a whole.

Devs are the constraint on the throughput of the system (the bottleneck). That's 10 people losing 40 mins a day, so 400 minutes a day of lost development effort. We said a fast machine might cut this in half, so we have 200 mins of needlessly lost development effort per day. How much does that cost?

We work an 8 hour day, 10 devs x 8 hours = 4,800 minutes of dev time available per day.

So the cost per minute for the throughput is £3,600 / 4,800 = £0.75 per minute (Wait you say, you took the cost of the team, divided by the time of the developers? I shall explain *3)

Finally £0.75 x 200 mins = £150 lost by the business every day

Conclusion

To sum up, it is costing the business £150 per day to have 10 developers using slow machines. Given we are paring on all dev work we only need 5 new fast machines. I know you can get a great machine for £1,000 (*4), which will be future proofed for the next 2 years or so. That's £5,000 in total.

£5,000 / £150 = 33 days. That's the number of days it takes to pay off the new machines by not losing the developers time waiting every day.

So is that £1,000 for a new dev machine worth it? I conclude it is, if the project is longer than 33 days. Is yours?


Appendix
  • Theory_of_Constraints on Wikipedia.
  • The_Goal_(novel) is an excellent book that describes the theory of constraints at a manufacturing plant in a story format.
  • 1 - We will only know how much better a great machine would be when we get one and use it on our project, but I suspect given the state of our current machines it will be half the time.
  • 2 - This is a low estimate, especially as I'm a consultant and get charged out at a higher rate than £200/day, but this is likely to be a conservative estimate for any company employing developers.
  • 3 - The theory of constraints says that the cost of the bottleneck is equal to the cost of the system as a whole. The goal of the system is to produce finished production ready functionality. Which part of the system is the bottleneck, stopping you from delivering more functionality? On our team it's us, the developers. We only release what is coded up every week. Nothing the testers or analysts can do can make us deliver more. So the output of the system is governed by the velocity of the devs. The cost of the team (in our case £3600) is the cost of the 20 story points we deliver that week, and it's the devs who control that velocity. That's not to say the other roles are not important, they are, critically important, but they are not the bottleneck.
  • 4 - Yes you should get a good machine for that. You could actually get a great computer for £500 - £600. We have the monitors and peripherals, and given we are a big company we would qualify for Dell's corporate rates.

Monday, 7 March 2011

The true cost of TFS, is it really "free"?

You say you've got MSDN premium, so TFS is free, good for you, it is developed and supported by Microsoft, should be a great product then??

Anyway in my personal opinion, it sucks, but try telling that to none technical people, its actually really hard, and they still insist you use it because its designed for enterprise use, isn't it?

So i thought id do a 'back of the napkin' calculation of how much it actually costs.

Our dev team is apparently worth ~40k a month, consisting of 4 devs, designer, tester, db admin, tester, ba,
10 people, for arguments sake ~4 grand each per month.
So if you take a dev pair thats 8 grand a month, or 2 grand a week.

Where is the waste (source control)?
Check-ins :- We check in 7 to 10 times a day, each time it should be instant, but mostly TFS cant quite manage it, it needs user interaction to resolve the easiest of changes, some times it cant even manage to insert new lines. So estimate 3 minutes extra per check-in thats 20 minutes a day extra, or 2 hours per week. (Caveat, if you are working in the same area of code as another pair be prepared for this to at least double, ive had some awful merges in the past even when the conflicts weren't really that hard)

Get latest :- Sometimes get latest doesn't even get the latest, leaving files out or just getting it wrong?? how?? so now and then we need to sort it out, usually after wondering what on earth is going on and trying to debug your code only to find out my source is not up to date (10 - 20 mins per day on average, 1 hr per week)

Get specific :- So, often you start using get specific instead of get latest, this is slow so we try not to do it all the time, only when we think there might be a problem, the code base is big so this takes a lot longer than a get latest 2-3 minutes extra per check in, but only done 2-3 times a day (7 minutes per day, 30 mins per week)

Merge to main (feature branching) :-
Depending on how often you merge to main, and how many other teams you have also checking into main that is going to hit you quite hard. if you are a lone team with out any teams changing your code base you have it easy and can discount this step. for me its at least a 4 hour job of doing the merge to main once every month)

Where is the waste (Build management)?
MSBuild and TFS :- This is complex, significantly more complex than the same projects built with nant and cruse control, Team city, Go, et al. it sucks a lot of our time when we need to change the builds, its hard to say how much worse it is, our code base is quite old and complex, lots of build dependencies, this needs fixing, lets be conservative and say it only takes 1 hour extra per week to maintain TFS over any of the others.

Total Waste
2 hrs + 1hr + .5 hrs + 1hr = 5.5 hours of waste a week, lets call it 5 for now, I like round numbers.

So a pair of devs is on 2 grand a week, 35 hours = £60 per hour
5 hours waste = £60 * 5 = £300 per week per pair
2 pairs in our team = £600 per week * 4 = £2,400 per month on a £40,000 dev team

Thats just a 2 pair team, if you have even a moderate size team of 4 pairs you are going to get even more pain, with developers effecting each others check ins.

Oh and what about that merge to main hell we discussed (if you are feature branching), add 4 hrs * £60 per month = £240 extra.

Summary :-
your "free" version control and build agent is not looking so "free" any more.
Its costing us at least 25 grand a year... that sounds wrong? can you please check my math...

How much is it costing you?

Disclaimer:-
In my opinion I've been quite lenient in my estimates, but when you say the numbers and add it all up it sounds awful, but it is.
Also the numbers above don't take into account other teams costs, if you have 3 dev teams (like ours) all working on the same source code, merging every month (feature branch style), all having the same pain, the figures quickly become a big drain on the business.

Problems :-
The main problem I have is how to quantify the waste, often its small things here and there, they just add up, not all the time, but especially if the team is doing TDD properly and going through refactor cycles frequently, which we are.
Any ideas on how to quantify the waste better would be appreciated.


Amendments (11-03-2011)
Thanks to my reviewers (kat, skain) for pointing out my grammatical and spelling errors (now corrected). But i did just knock out this article in the gaps i had whilst waiting for TFS, i guess its good for something. Joking apart though this does lead me to something i didnt mention and that is context switching inefficiencies. So every now and then you get 5 minutes to do other tasks, email, ect, but this is a big context switch for the pair, it takes a little time to get back into the flow again, this cost is not accounted for in the above monetary costs.

Monday, 28 February 2011

AppHarbor - free .net hosting with continuous integration, Getting started tutorial

Ive been test driving appharbor recently and im very impressed.

Its basically a host for your .net web apps, but with a difference.
First you deploy to appharbor via a git push, as soon as you do this your app is built, your tests are run, and if all goes well (build succeeded and tests passed) your code is deployed to the hosting environment there and then.

Thats all sounds pretty simple, and is very impressive, especially since its free for a single web instance and a 20MB database.

So how do you go about doing it, how do you get a ASP.MVC 3 web app on the interweb in 15 minutes (if that) for free.

  1. Create a solution with a single MVC 3 web app in it, im using VS2010 (1 minute)
  2. Add a controller and a view, just static content will do (1 minute)
  3. Create a git repository in the folder that contains your solution. Just run "git init" (1 minute)
  4. Add your web app to the local repository "git add ." but be careful not to include the bin, obj or _resharper folders then Commit changes locally "git commit" (1-2 minutes)
  5. Log into appharbor and create a new application (1-2 minutes)
  6. Get your remote repository URL from the appharbor administration interface (1 minute)
  7. Add remote repository to your git repo: "git remote add appharbor https://UserName@appharbor.com/AppName.git" (1 minute)
  8. Push your app to git: "git push appharbor master" (1 minute)
  9. Log on to appharbor and navigate to your new app, see the successful build (1-2 minutes)
  10. Navigate to the live url and see the site live on the interweb (1-2 minutes)

Superb
I said 15 minutes, you can actually do it in a lot less, but you get my drift.

So what can you do :-)
  • Add test projects, your code will only be deployed if all the tests pass, brilliant.
  • Roll back to last deployment, very easy to do, if your not happy with the release, just click deploy on a older build and that older build gets redeployed, perfect. 
  • You can add your own host name
  • Add worker processors (at a cost)
  • Have multiple collaborators to the same project and use appharbor as the master repo (a bit like github) its really easy to get get the source on to a different machine, use "git clone https://UserName@appharbor.com/AppName.git"
What cant it do :-(
  • Acceptance tests, i use BDD style tests a lot, webdriver, selinium etc. it cant run these, and think about it, it makes sense. If a failing test stops deployment how can you run tests after you have deployed? I guess they need to develop a staging environment similar to Azure which gets deployed to first. I think that is on the pipeline of improvements but not at a high priority.
  • No file storage, only what is checked into your repo, you can save things to the file system, but they will get blown away with each deployment. i guess you could use amazon EC2, google or Azure to store your files using their REST APIs but that could be slow for the users, options exist though.
  • If/when tests fail you dont get a very good message, only a stack trace, you dont get the expected and actual values, not sure why this is, but its not a show stopper by any means.
  • Only one web app per solution is allowed, i guess this is because appharbor uses convention over configuration, and will automatically deploy the one web app there to the hosting environment.

Monday, 13 December 2010

Edward Deming and his Red Bead Experiment, in practice.

We had an interesting brown bag lunch meeting the other day about Edward Demings red bead experiment. I've heard and read about it before but never got to participate, it was interesting, thought provoking and fun. Some good discussions afterwards as well.

Edward Deming was a management consultant and statistician. He had a massive impact on the management styles and philosophy of Japanese business in the 50's and 60's. He used the red bead experiment to illustrate the impact that a system, and traditional management approaches, can have on individuals who work within a system, and how traditional management approaches (slogans, the usefulness of targets, annual appraisals and financial rewards) are not always (if ever) that effective at improving quality.

Details on the red bead experiment and how it is performed can be found here http://www.redbead.com/. For our results in the actual experiment read on.

Results
The session was run by a thoughtworks colleague, in a really good way, we had the workers, the management, the QA staff, and lots of fun.

The workers were set targets of 5 defects max per person ( a total of 15 per iteration for the team)
The 3 workers, were split into 2 average and 1 good (what ever that means)

Iteration1234Developer Totals
Dev1685726
Dev21075729
Dev378101136
Iteration Totals2323202591

After iteration 1 workers were told that their efforts were not good enough, and basically told off by management. This made no difference, and so, after iteration 2 the workers were given incentives and appraisals, if they upped their game they would be given hard cash. This worked and management were encouraged to do more of that, offering bigger rewards for better performance.
But iteration 4 was the worst yet and so managers assumed that the incentives had failed because no one actually achieved them last time.

So what does this actually tell us?
That in a fixed system where the workers have no ability to manage or better themselves or their work, the management effectively can not effect workers performance though traditional carrot and stick management.

How does this relate to Software?
I have found that as software developers we don't get to change the system as a whole very often. Often software is seen as the solution to business problems, when actually changing the system would be a better approach. Just by making the process electronic doesn't always work and often makes things worse or masks the underlying problem. This is just another reason why software projects fail.

The experiment also relates to the software development process. If software engineers work in a rigid system where QA and strict process is seen as putting the quality in. Where the engineers don't have the ability to change their environment (technology, process, physical environment, methodology) then no amount of incentives, slogans, rewards can make the software produced better (less defects, meeting business requirements more effectively, etc.). I have seen this at several clients, and can say that clients who have empowered workers have a big advantage, these companies have better motivated, more professional developers and in the end better software.

Summary
Systems Thinking is a really interesting field at the moment and if you want to read more do a google for Edward Deming, systems thinking and John Sedden.

So even if you are CMM level 5 (i.e your processes are robust and repeatable) you can still have quality issues, The red bead experiment highlights that it is not process that produces quality, nor rewards, targets or incentives, its the system within which workers work that matters and their ability and motivation to help change and adapt the system.